
Cost and latency engineering for LLM systems
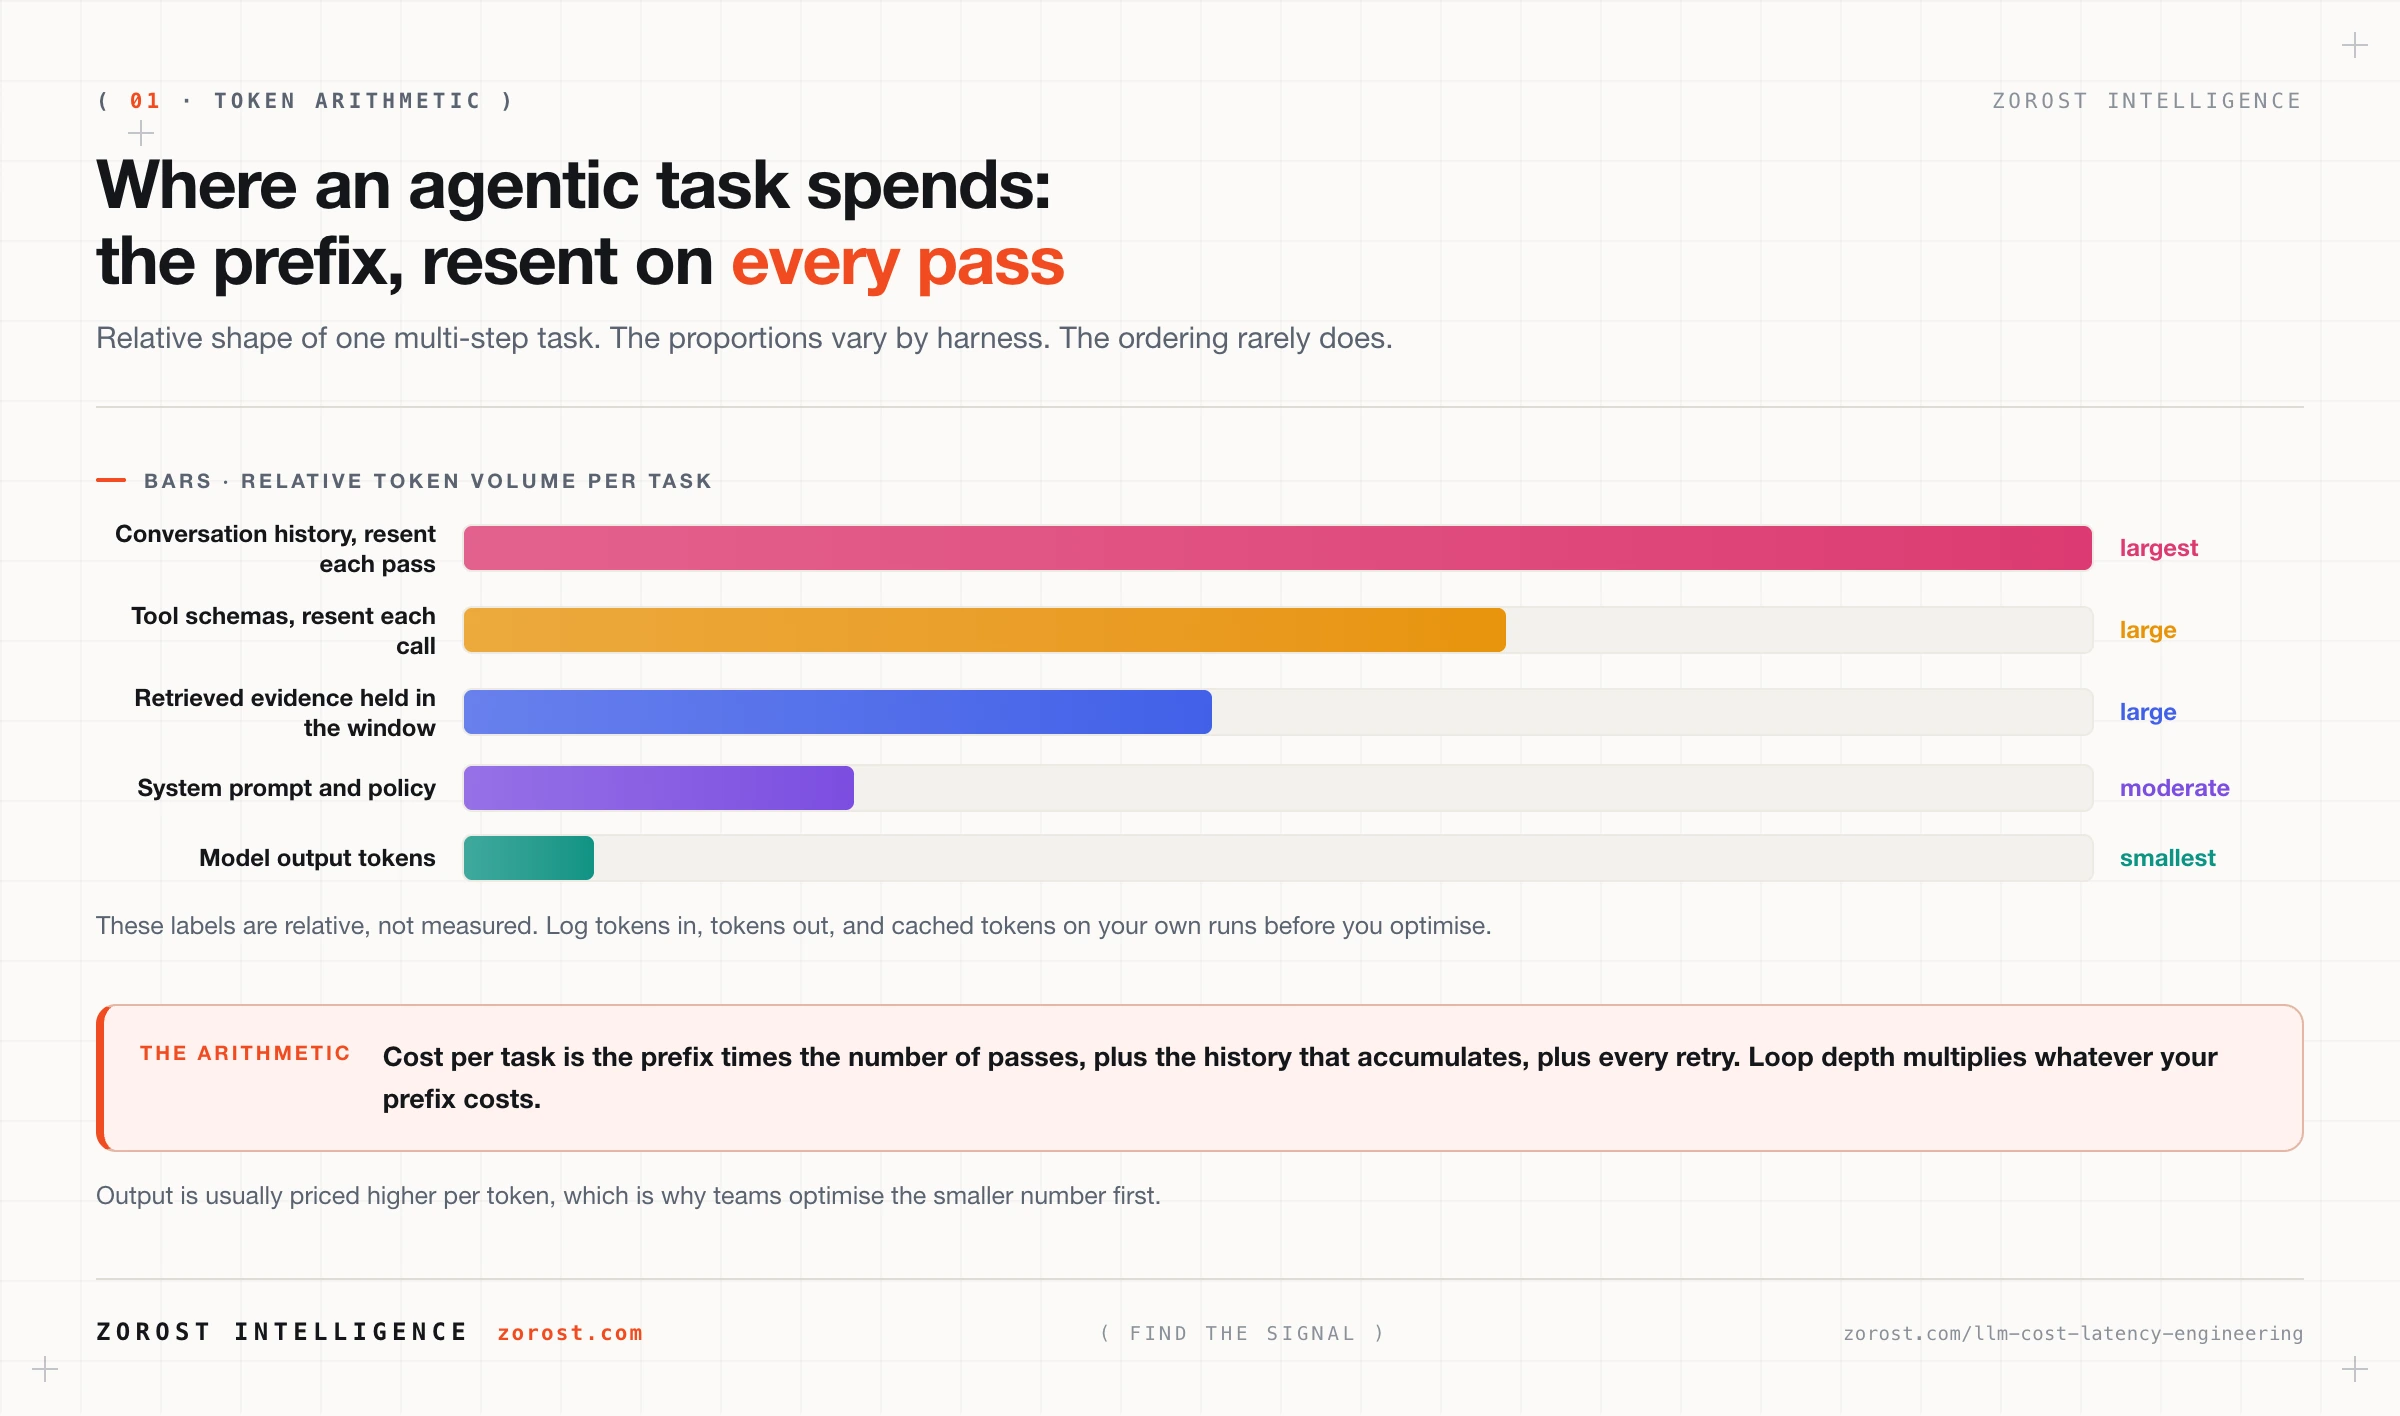
Pull-quote: “The cheapest token is the one you never send, and an agent loop sends the same tokens again on every pass.”
LLM cost and latency are design outcomes of the harness you build, settled long before you compare vendor prices. The same model on the same task produces very different bills for two teams, because one resends the whole conversation and every tool schema on every pass of the loop and the other does not.
This post is for engineers who have an agent working and have just read the invoice, or who shipped something slow enough that users stop waiting. One term carries over from the rest of this series: the harness is the code around the model that runs the loop, holds state, calls tools, and enforces budgets.
What you will be able to do
- Estimate the token cost of an agent task from numbers your harness already logs.
- Build a routing ladder that sends each call to the cheapest tier that passes evaluation.
- Lay out prompts so a provider cache hits the stable prefix instead of missing on a timestamp.
- Cut wall-clock time with parallel tool calls, batching, and streaming.
- Enforce per-task token, step, and time budgets, and degrade deliberately when one runs out.
- Judge every optimisation by cost per successfully completed task.
Where does the money actually go in an agentic system?
Input tokens go to the model over and over, and that repetition is where an agentic system spends its budget. Every pass sends the system prompt, the schema for each tool the model may call, the memory and evidence you packed, the history of tool calls and their outputs, and the current instruction. The model answers with a short tool call, and the whole stack goes back over the wire on the next pass.
Take round numbers. Your system prompt runs 1,200 tokens, twelve tool schemas add 2,800, and you packed 3,000 tokens of evidence, so the fixed prefix is 7,000. Each pass appends about 700 tokens of tool call and output, and the task finishes in eight passes. You pay the prefix eight times, for 56,000, and the accumulating history adds 19,600 on top: the model reads roughly 75,600 tokens and writes perhaps 1,200. Output is usually priced higher per token than input, which tempts people into optimising the smaller number.
Two properties of that arithmetic outrank any price. The accumulating term grows with the square of loop depth, so sixteen passes cost well over double what eight cost. And a retry at pass six replays every token before it, which makes a late failure structurally more expensive than an early one.
| Driver | Why it repeats | The lever |
|---|---|---|
| Tool schemas | Sent on every call | Prune the set, load tools per phase |
| History | Appended each pass | Summarise observations, evict on policy |
| Retrieved evidence | Survives until removed | Compress to a finding, drop the source |
| Retries | Replay the whole prefix | One retry authority, capped by budget |
Log tokens in, tokens out, cached tokens, tier, tool calls, wall clock, and termination reason on every run. The packing discipline in context engineering as a budget you spend reads this problem from the other side: tokens that earn nothing are billed again on every pass they survive.
Why is cost per completed task the only number worth trusting?
Cost per successfully completed task is the number to optimise, because everything you spend during failures lands in the numerator while nothing lands in the denominator. Divide total spend across a task suite by the tasks that passed, and the arithmetic stops flattering you.
A small model that handles most cases but triggers a repair loop on the rest may beat a frontier model or lose to it, and only measured cost per success says which. Verification calls belong in the numerator, and so do evaluation runs. Evaluating agents by grading runs covers building that suite with cost and latency as graded metrics. One checkpoint before you optimise anything: if your logs cannot answer “what did the median successful task of this type cost, in tokens and in seconds”, build that reporting first.
How do you route work to the cheapest model that can do it?
Route by task difficulty and let each call settle at the lowest tier your evaluation suite says still passes. Model routing is choosing a model per call from the shape of the work, rather than configuring one model for the whole system.
| Tier | Handles well | Signal you went one tier too low |
|---|---|---|
| No model | Parsing, lookups, cached decisions, conversion | You are parsing genuinely ambiguous input |
| Small | Classification, extraction to a schema, routing | Schema repair loops fire regularly |
| Mid | Drafting, tool selection, most loop iterations | Plausible wrong tools, thread lost across passes |
| Frontier | Ambiguous decomposition, novel reasoning | Cost is the only constraint left |
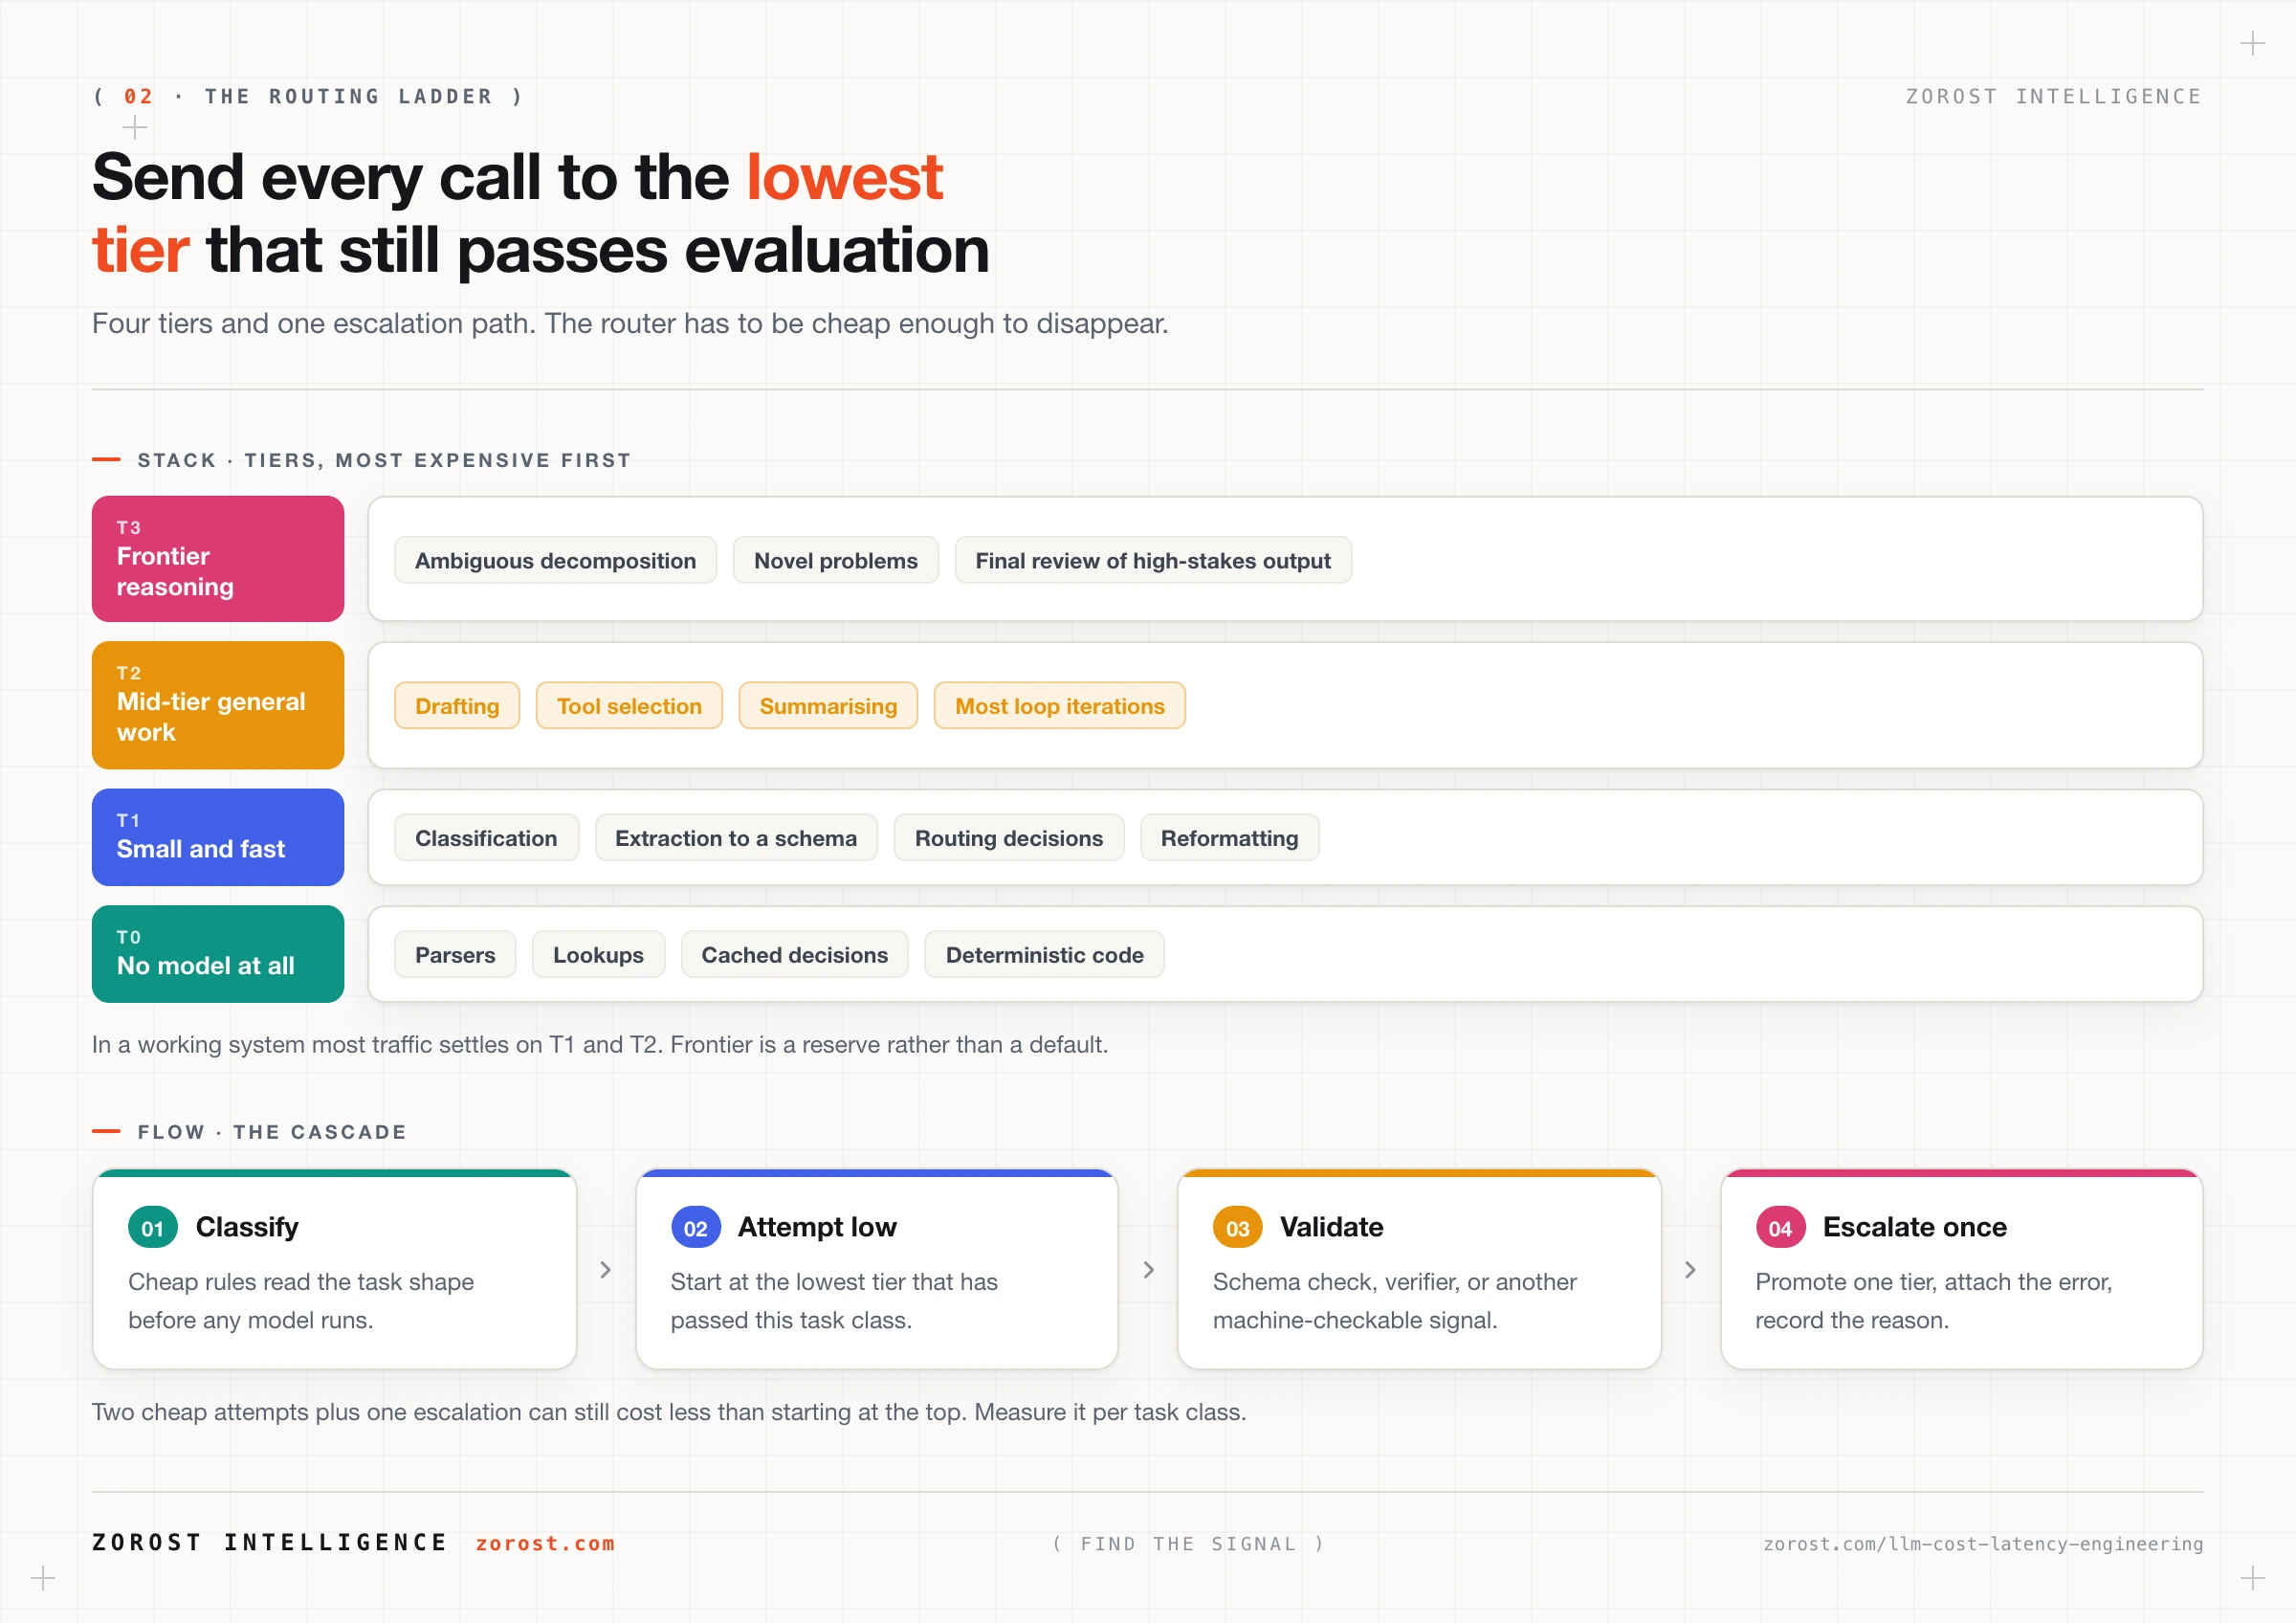
Build the router in the cheapest form that can decide. Rules on task type cost nothing, and neither do request features such as input length, applicable schema, and tools in scope. A cascade buys the most: attempt the low tier, validate, and promote one tier on failure.
def choose_tier(task):
    if task.kind in CACHED_DECISIONS:
        return "none"
    if task.kind in ("classify", "extract", "route"):
        return "small"
    if task.needs_plan or task.novel:
        return "frontier"
    return "mid"

result = call(tier, prompt)
if not validates(result) and tier != TOP_TIER:
    # Escalate once, carrying the failure so the next tier knows what broke.
    result = call(promote(tier), prompt, note=validation_error(result))
Escalate on machine-checkable signals: schema validation failure, a verifier that disagrees, a tool returning the same error twice. Self-reported confidence is weak on its own, because models are poorly calibrated about their own errors.
Set the boundary with data. Run each task class at every tier, read the pass rate, then compute cost per success; the boundary sits where the pass rate falls away. Watch the trap at the top: a router that calls a model to choose a model has added a call to every request.
What makes prompt caching hit, and why does prompt order matter?
Prompt caching is a provider-side optimisation that stores the model’s computed state for a prefix of your prompt and reuses it when a later request starts with exactly the same tokens. It pays off only when the front of your prompt is byte-identical call to call, so one changed character at position forty invalidates everything after it. Order the prompt by volatility, most stable content first.
1  system instructions and policy      changes on deploy
2  tool schemas, in a fixed order      changes on deploy
3  long-lived context: glossary, standards, org facts
4  the task instruction
5  retrieved evidence for this task
6  conversation history
7  the newest tool observation         changes every pass
The cache killers are small and well intentioned. A timestamp or request id at the top of the system prompt. Tool schemas serialised from a dictionary with unstable key order. A per-user greeting above the policy. Trimming the oldest turns off the front of the history also shifts the prefix, so evict from the middle instead.
Treat the cache as an optimisation rather than a guarantee, since entries expire and providers differ in what they charge to write one and how long it lives. Your checkpoint is the usage payload: caching providers report cached token counts per call, and a hit rate that collapses after a prompt change tells you what you broke.
When should the harness run work in parallel instead of in sequence?
Run independent tool calls concurrently whenever their results do not feed each other, because a sequential loop pays the slowest tool’s latency once per step instead of once per batch. Models often request several calls in one turn and many harnesses still execute them one at a time.
Eligibility comes from the side-effect declaration on each tool. Read-only and idempotent calls fan out safely. Writes stay serial, ordered, and behind whatever approval they require, since two concurrent writes to one record produce a state nobody predicted.
Keep the two goals separate. Parallelism cuts wall clock and leaves token spend untouched. Batching cuts tokens: fifty classification items in one request amortise the prefix rather than paying it fifty times, which is why offline work belongs in batches. Prefetching the retrieval you will probably need hides latency at the price of the guesses you discard, and parallel sub-agents multiply spend because each branch carries its own prefix.
Why does perceived latency matter more than measured latency?
Users judge a system by time to first useful signal, so streaming and visible progress often buy more satisfaction than shaving seconds off total runtime. A run that streams its plan in the first second and narrates each tool call feels responsive even when it finishes later than a silent one.
Stream tokens as they arrive, emit the plan before executing it, show each tool call as one line of plain language, and firm up partial results in place. Instrument time to first token alongside total wall clock, because a change that improves one can worsen the other.
Perception stops mattering when nobody is watching: scheduled jobs and machine callers care about throughput. Two caveats. Streaming reduces no cost, and it complicates validation, since you cannot check a schema against half an object.
How do you enforce a cost budget inside the harness?
Give every task a budget object, check the next call against it before making that call, and treat exhaustion as a termination reason the harness returns rather than an exception it throws. A budget that reports after the spend is accounting. A budget the loop consults is control.
@dataclass
class Budget:
    max_input_tokens: int
    max_steps: int
    deadline: float                # monotonic clock
    spent_input: int = 0
    steps: int = 0

    def admits(self, est_input: int) -> bool:
        return (self.spent_input + est_input <= self.max_input_tokens
                and self.steps < self.max_steps
                and time.monotonic() < self.deadline)

if not budget.admits(est_in):
    state = degrade(state)         # compress, drop optional tools, narrow goal
    if state is None:
        return Result(status="incomplete", reason="budget_exhausted",
                      partial=best_effort())
Degradation needs a written policy, because the alternative is whatever the exception handler happens to do. Tight on tokens, compress history and drop optional tool schemas before dropping capability. Short on steps, narrow the goal to the highest-value subtask and say so in the result. Out of retries, escalate one tier with the error attached, then stop.
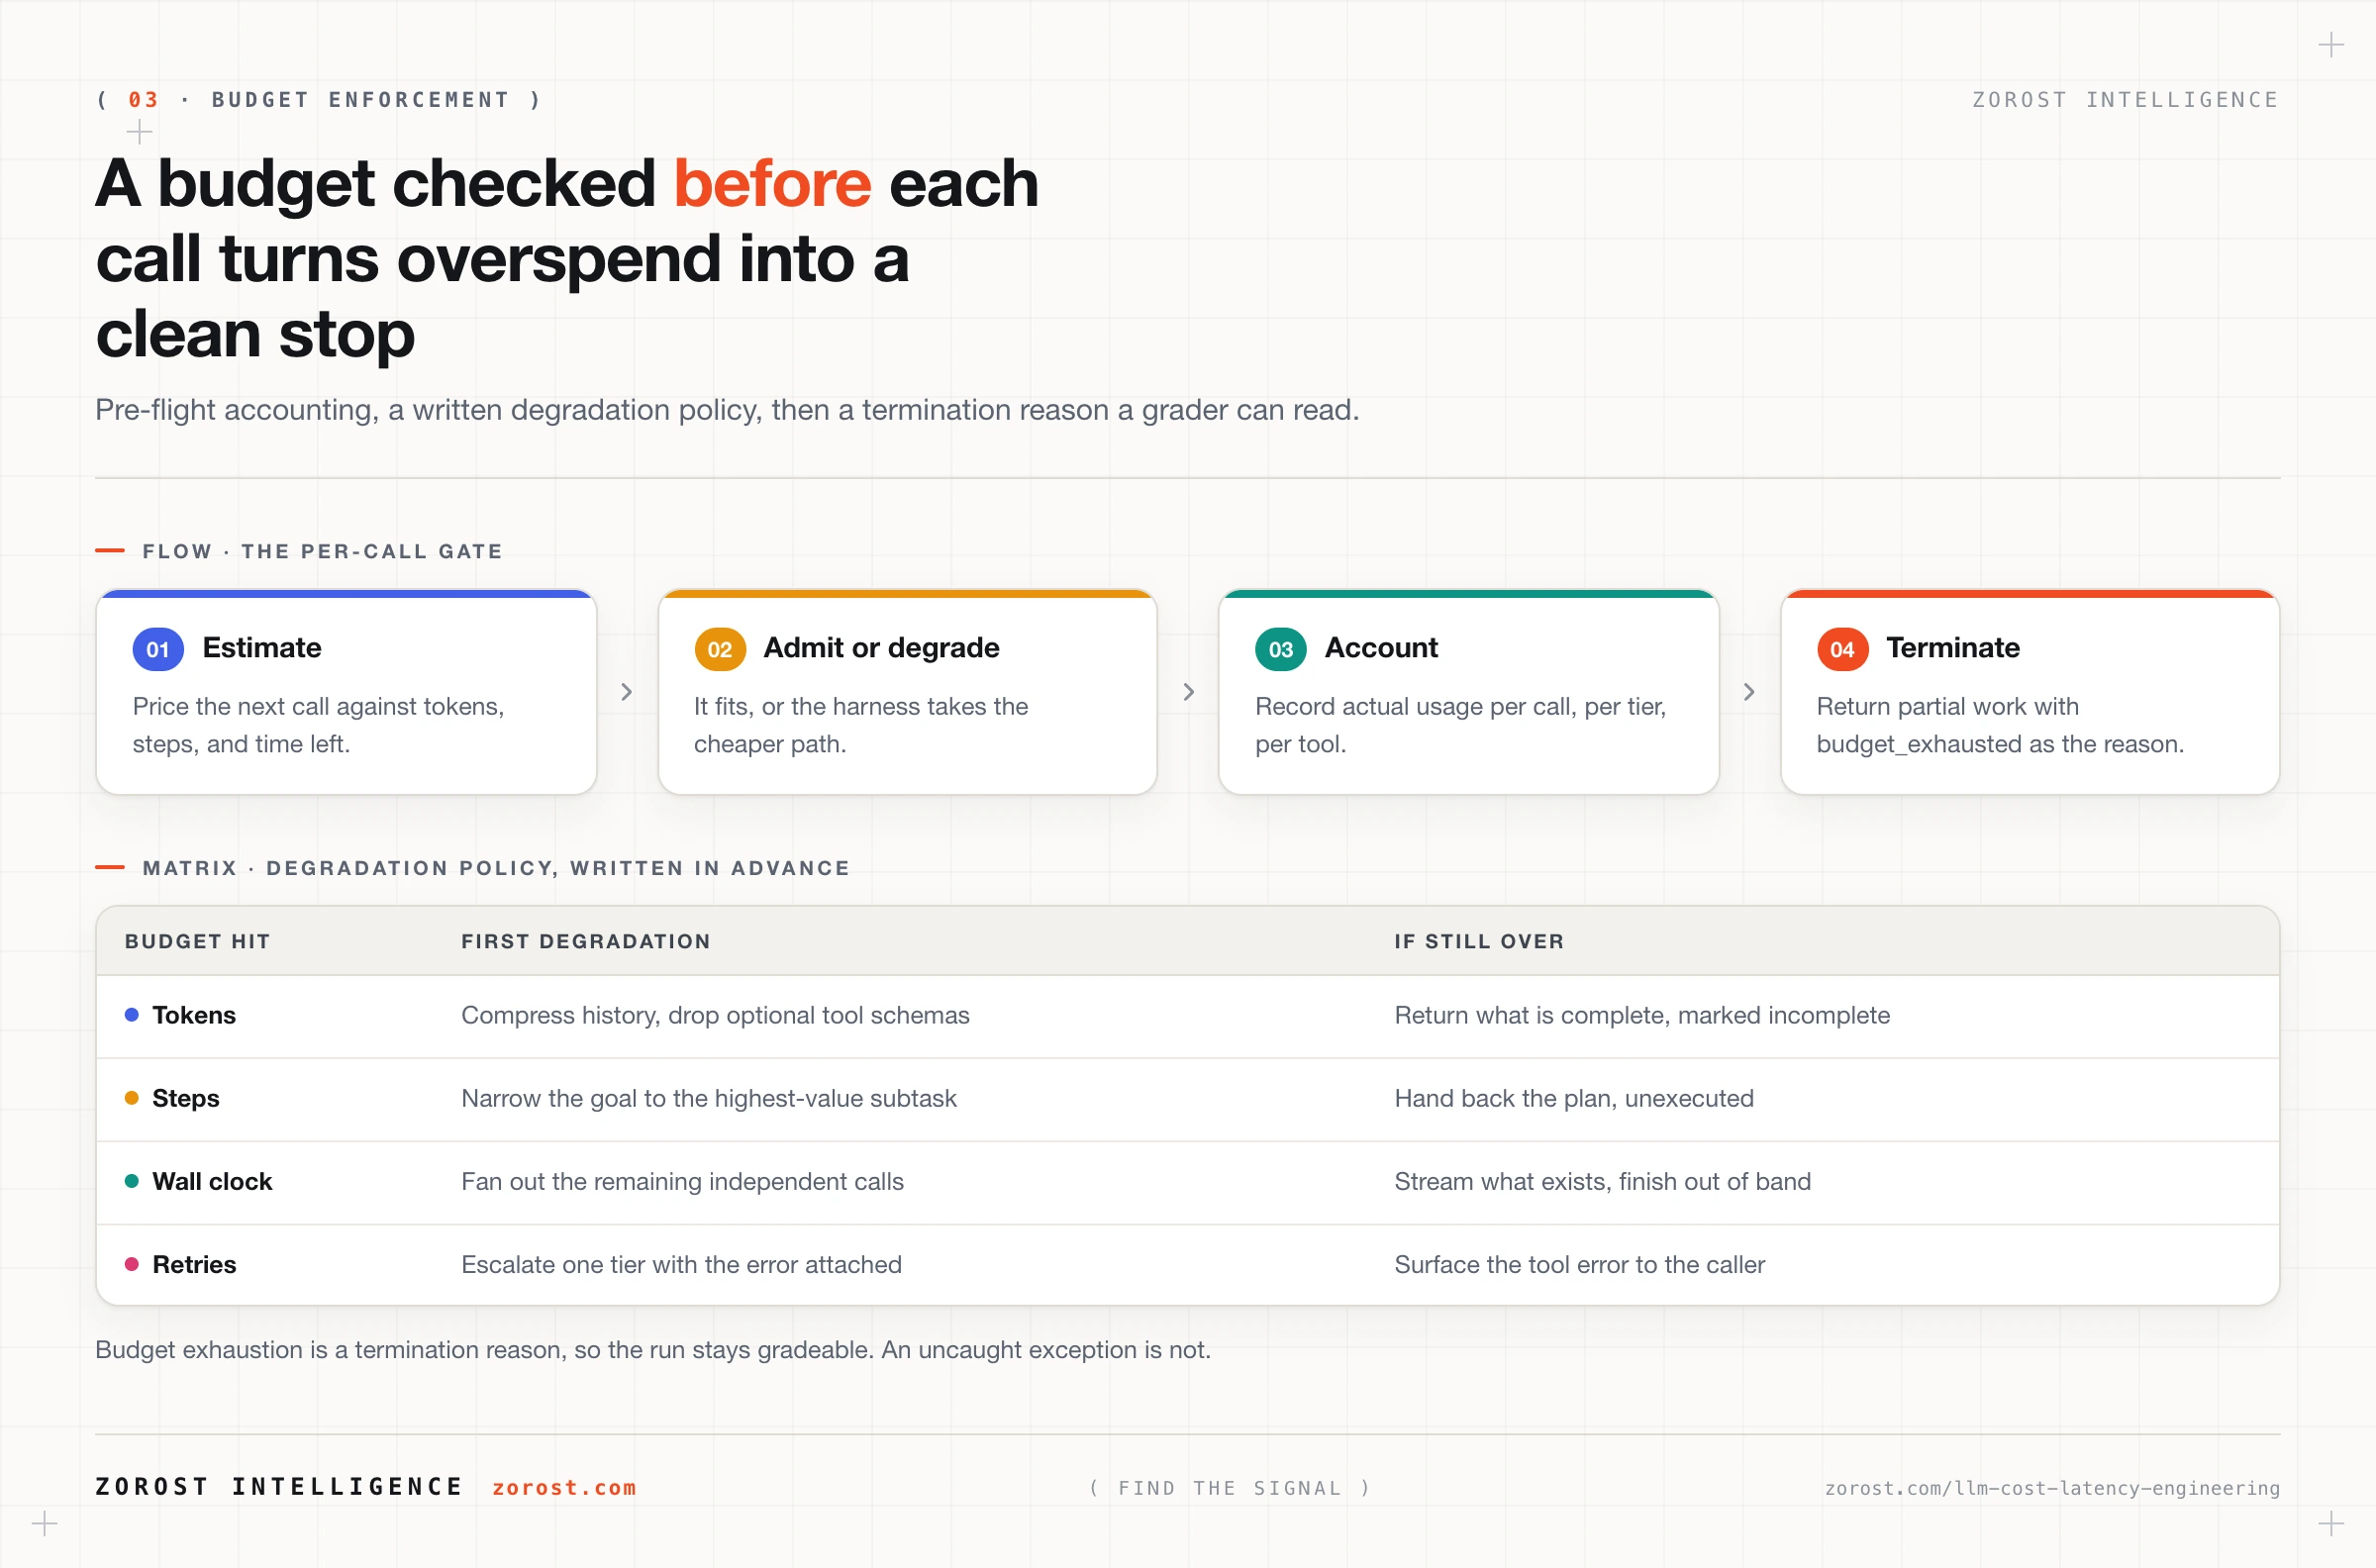
Your checkpoint: run a task with max_steps=2 and confirm the record ends with reason=budget_exhausted, carries a partial result, and grades as incomplete rather than failed. An uncaught exception means the budget is decoration. The same counter, aimed at a different problem, becomes a security circuit breaker, which is where the next post picks it up.
When does self-hosting become cheaper than per-token pricing?
Dedicated inference wins when utilisation is high and steady, because per-token pricing is pure variable cost while a GPU you rent or own is a fixed cost you want busy. The crossover depends on tokens per hour, how flat the load is, and which model size you still need after routing. Data that cannot leave your boundary and air-gapped deployment settle the question before cost enters. Running an agent fully local with vLLM, Ollama, and llama.cpp covers the serving side.
Where this goes wrong
A prompt tweak that multiplies the bill. Someone adds the current date to the top of the system prompt, cache hit rate goes to zero on the next deploy, and nothing looks broken because answer quality is fine. Move volatile values below the stable prefix and add a test that fails when the first N tokens change.
Retry amplification during an incident. A provider degrades, the tool layer retries, the loop retries the tool, and a job runner retries the whole task, so one failure becomes many full-prefix replays. Give retries a single authority, cap them in the budget, and open a circuit breaker when a dependency keeps failing. The production agent failure taxonomy has the detection signals.
Context growth as a slow leak. Each pass appends full tool output, so cost per pass climbs and long tasks cost more than their length suggests. Summarise observations into findings at ingestion, keep raw output outside the window behind an identifier, and evict on a policy rather than waiting for truncation.
A budget that crashes the run. The cap trips, the harness raises, partial work is lost, and the record shows an exception rather than a decision. Return a structured incomplete result with the reason and the best available output, so the caller can choose to extend the budget.
Common questions
Does a cheaper model always save money?
No. A cheaper model saves money only when it completes the task often enough that its retries, repairs, and verification calls stay below the cost of the better model. A model that is cheap per token and needs three attempts is not cheap. Compare tiers on cost per successfully completed task over a real task suite.
Is prompt caching safe to depend on?
Depend on it for cost and latency, never for correctness. A cache hit returns the computation the model would have performed on that prefix anyway, so answers should not change, but entries expire and a hit is never guaranteed. Design so a total miss is slower and dearer rather than broken.
Why did my costs rise when I added tools?
Tool schemas are sent with every call so the model can choose among them, so each tool you add taxes every pass of every task, including tasks that never use it. Prune tools you do not need, load tool sets per phase, and keep schemas terse. Fewer, better-named tools also improve selection accuracy.
What per-task budget should I start with?
Derive it from your own successful runs rather than picking a round number. Take the token and step counts of the passing runs in your suite, look at the high end of that distribution, and set the cap above it with room to spare. Then watch how often the cap trips: often means your tasks changed shape, never means it is too loose to protect you.
Next steps
Read the next post in this series, guardrails and prompt injection for systems that read untrusted text. The budget counter you just built is also the circuit breaker that caps what an attacker can spend on your account, and the tool permissions that keep parallel writes safe stop injected instructions becoming damage.
Running an agent cheaply across the full cost ladder applies the same ladder to a working harness, including the point where a cheap model becomes a false economy.
Cost per successfully completed task, rather than cost per call, is how Zorost reports agent and pipeline spend on the lakehouse as a trusted Databricks partner, where the routing tier for each workload is chosen against the evaluation suite before it ships and the budget lands in the run record beside the result.